
Dashboard
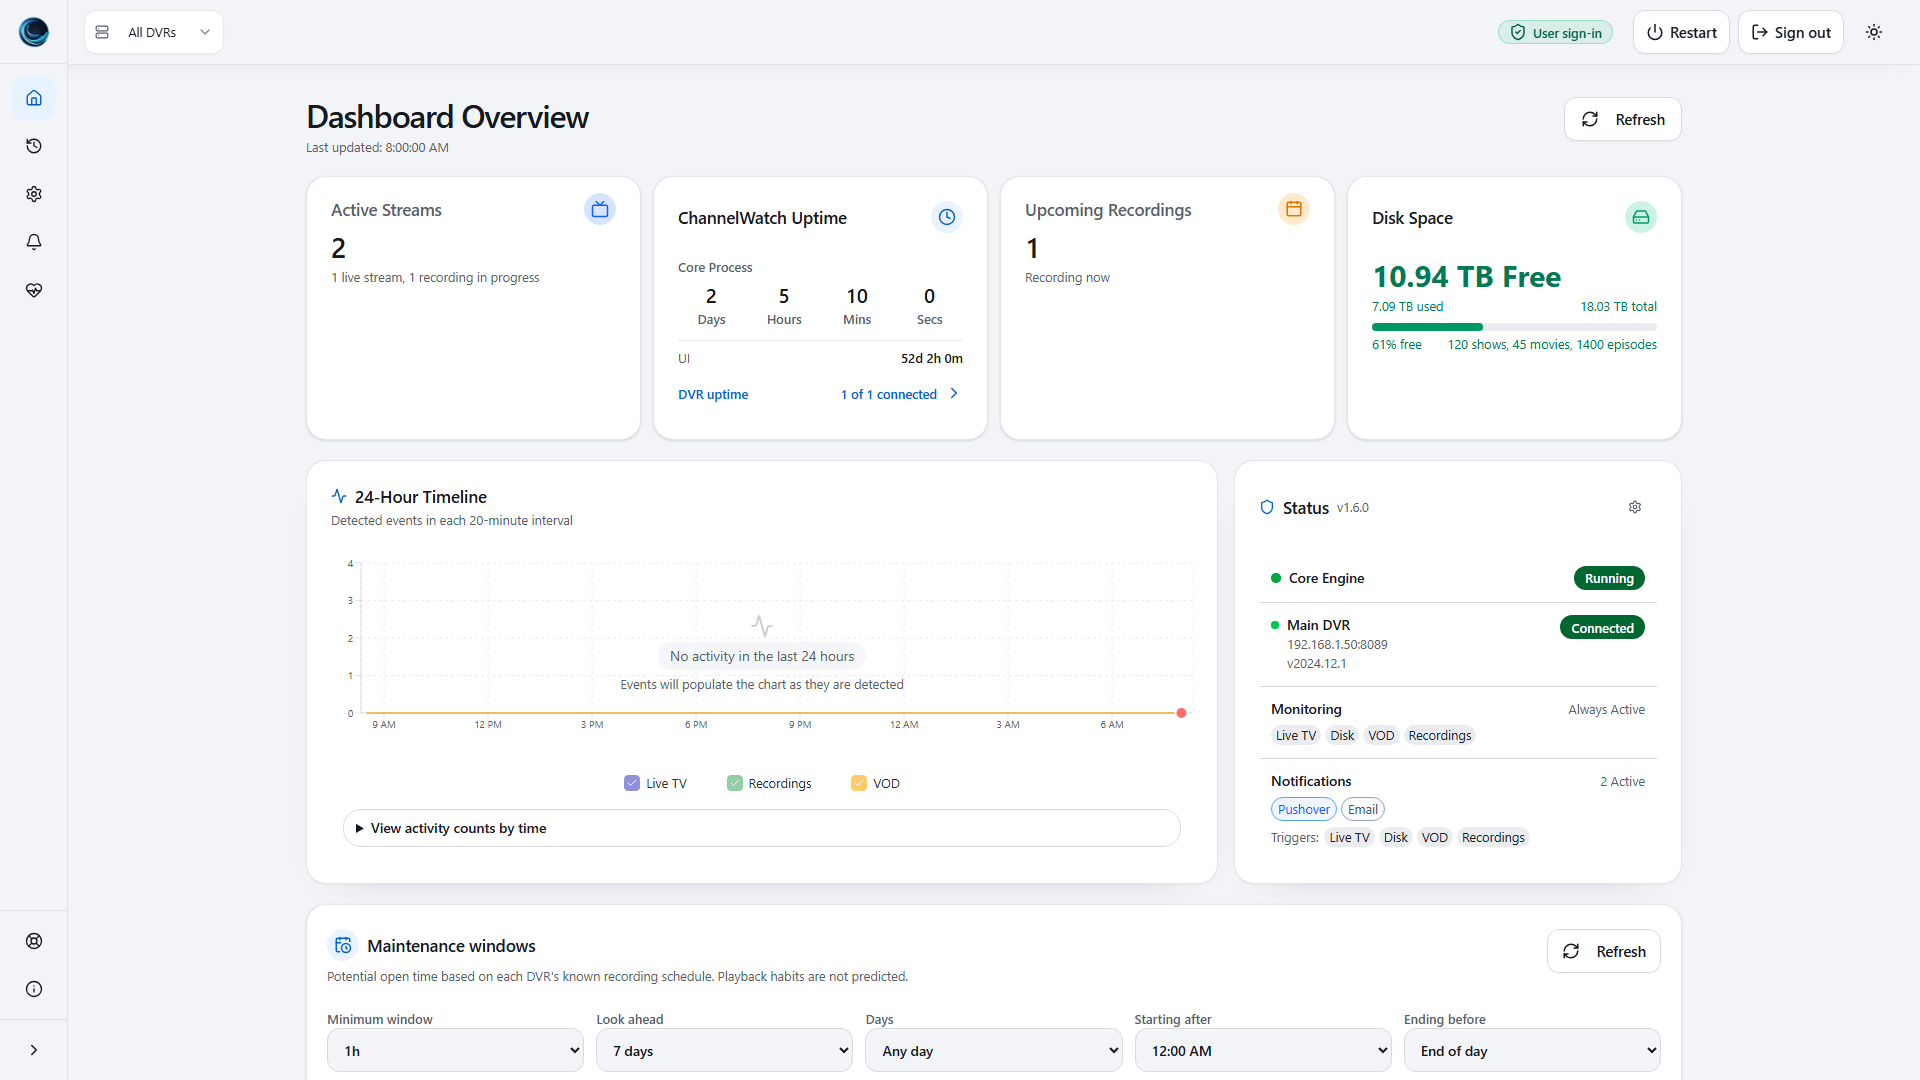
The Dashboard brings together current streams, upcoming recordings, disk space and DVR connection status. Start here for a quick check; use Watch History to search older activity or export it.
Find your way around
Section titled “Find your way around”On desktop and tablet, use the sidebar. On a phone, Home opens the Dashboard, History opens Watch History, Logs opens the Notification Log, and Settings opens configuration. More contains the remaining pages, including Diagnostics and Help & Feedback.
The DVR selector at the top changes the server scope. Choose All DVRs for the combined view or select one server to investigate it. Check that scope before comparing counts or troubleshooting a particular DVR.
Check the summary
Section titled “Check the summary”| Area | What to look for |
|---|---|
| Active Streams | Live TV, recorded-content playback and recordings currently reported by the selected DVR scope. |
| Upcoming Recordings | Scheduled recordings, including jobs that are recording now. Open a recording row for its schedule and DVR details. |
| Disk Space | Free and used storage. Expand the card for the storage breakdown. Configure warnings separately under Disk Space alerts. |
| ChannelWatch Uptime | Expand to distinguish the monitoring core, web UI and DVR uptimes. A core restart does not mean the DVR restarted. |
| Status | The monitoring core, DVR connections and enabled monitoring/notification settings. A connected DVR does not prove a notification reached your phone. |
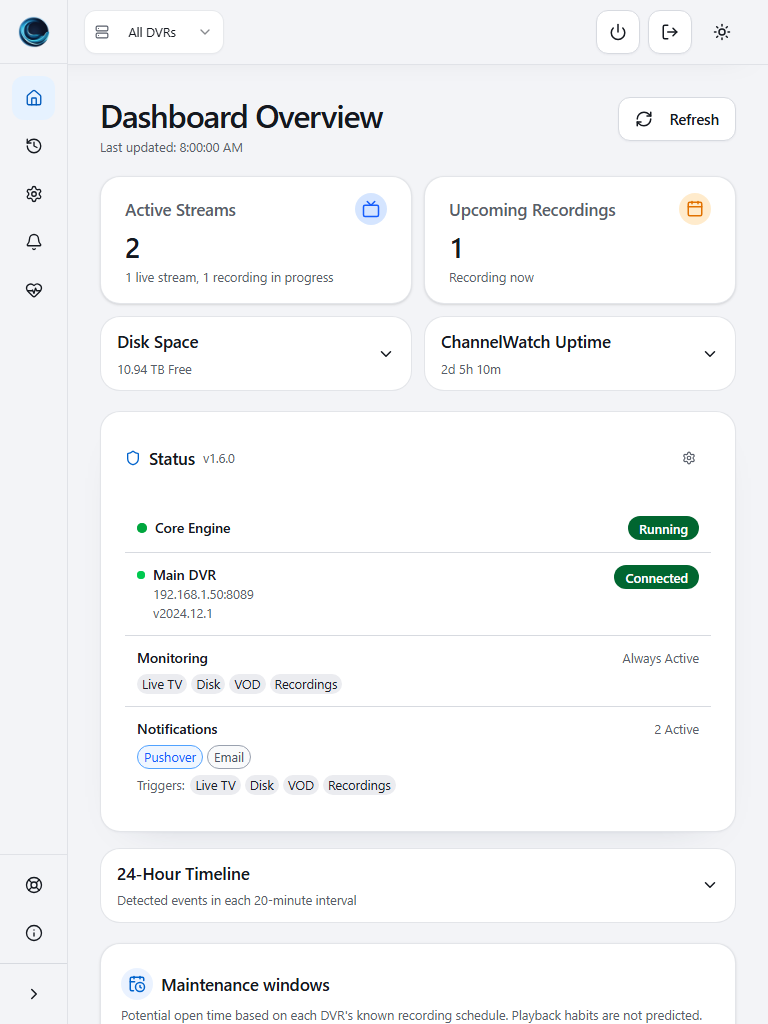
Some detail panels start collapsed to keep smaller screens short. Open the panel you need; the summary remains available while it is closed.
Follow activity and recordings
Section titled “Follow activity and recordings”- 24-Hour Timeline groups detected events into time intervals. Expand it when collapsed to see the chart and its details.
- Recent Activity lists detected playback, recording, disk and DVR connection events. Use its activity and client filters to narrow the list, then open a row for the available details.
- Upcoming Recordings shows known scheduled jobs. Open a row to inspect its scheduled time, channel and DVR. Missing artwork does not remove the recording details.
For a searchable list of retained playback and recording activity, open Watch History. To check whether an alert was sent, open the Notification Log instead.
Plan maintenance carefully
Section titled “Plan maintenance carefully”The Maintenance windows panel finds potential gaps in each DVR’s known recording schedule. Filter by minimum length, day and time before choosing a window.
A gap is not a promise that nobody is watching. Offline DVRs, incomplete schedules and unobserved time must not be treated as free time. Read Maintenance windows before disruptive work.
Check freshness before acting
Section titled “Check freshness before acting”Use Refresh to request current data and check Last updated. If a section cannot refresh, ChannelWatch can retain its previous data and show a warning. An empty list or an old value is not proof that a disconnected DVR is idle.
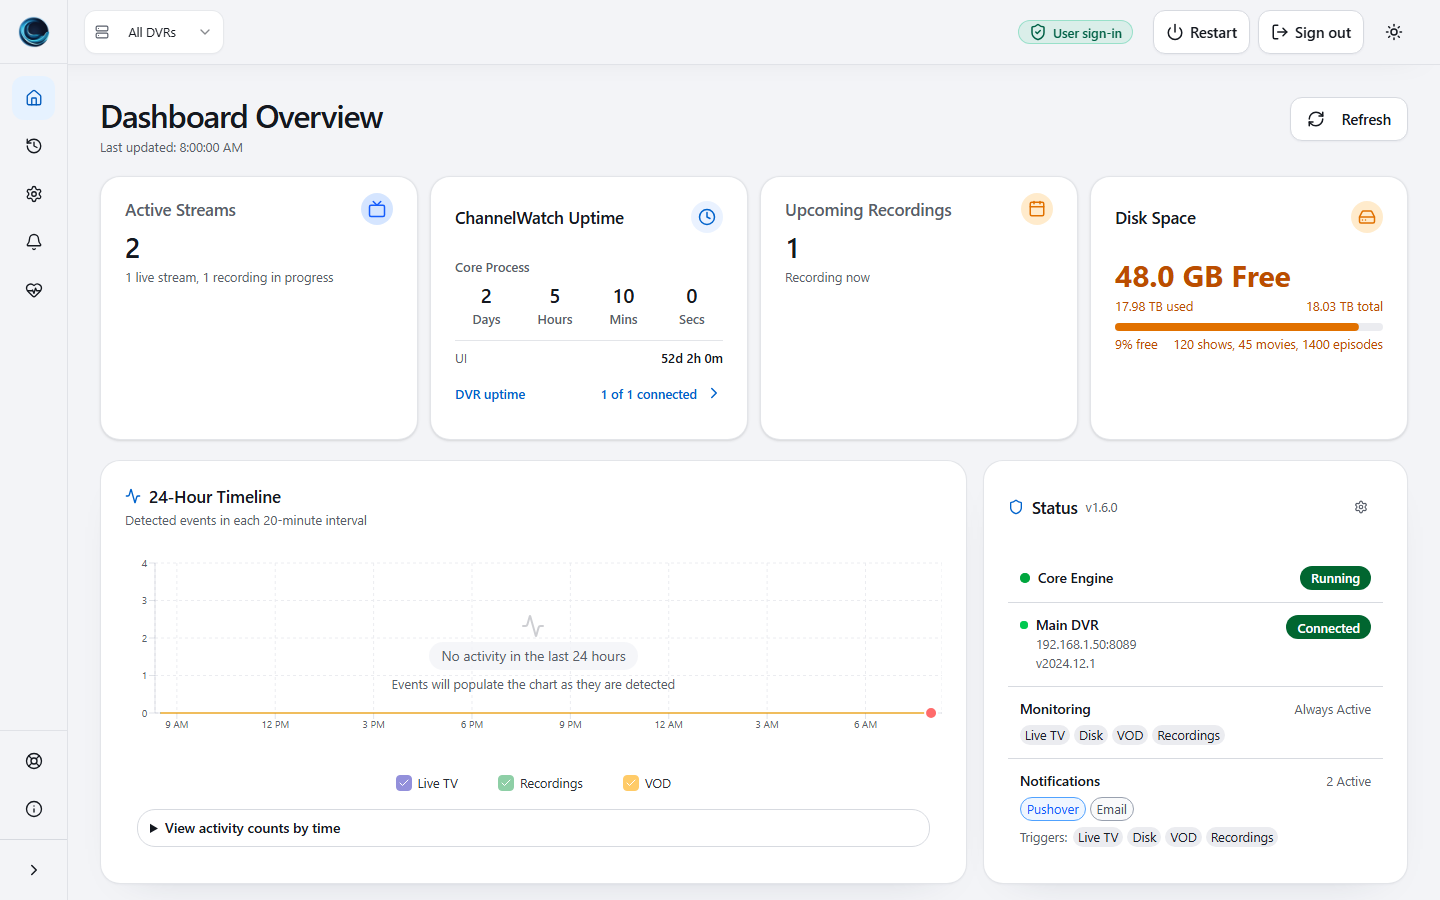
If data remains unavailable, check DVR connection settings and Common issues. Changing the Dashboard view does not change your alert configuration; use Alerts and notification routing for that.